Custom ML Dashboards
Build interactive dashboards for your data and machine learning models. Choose from 40+ visualization components, arrange them with drag-and-drop tools, or let AI generate optimal layouts for you.
Get Started
Visualize Data and Models
Dashboard Components
Choose from standard visualization components like charts and tables, plus specialized ML components for model analysis and monitoring.
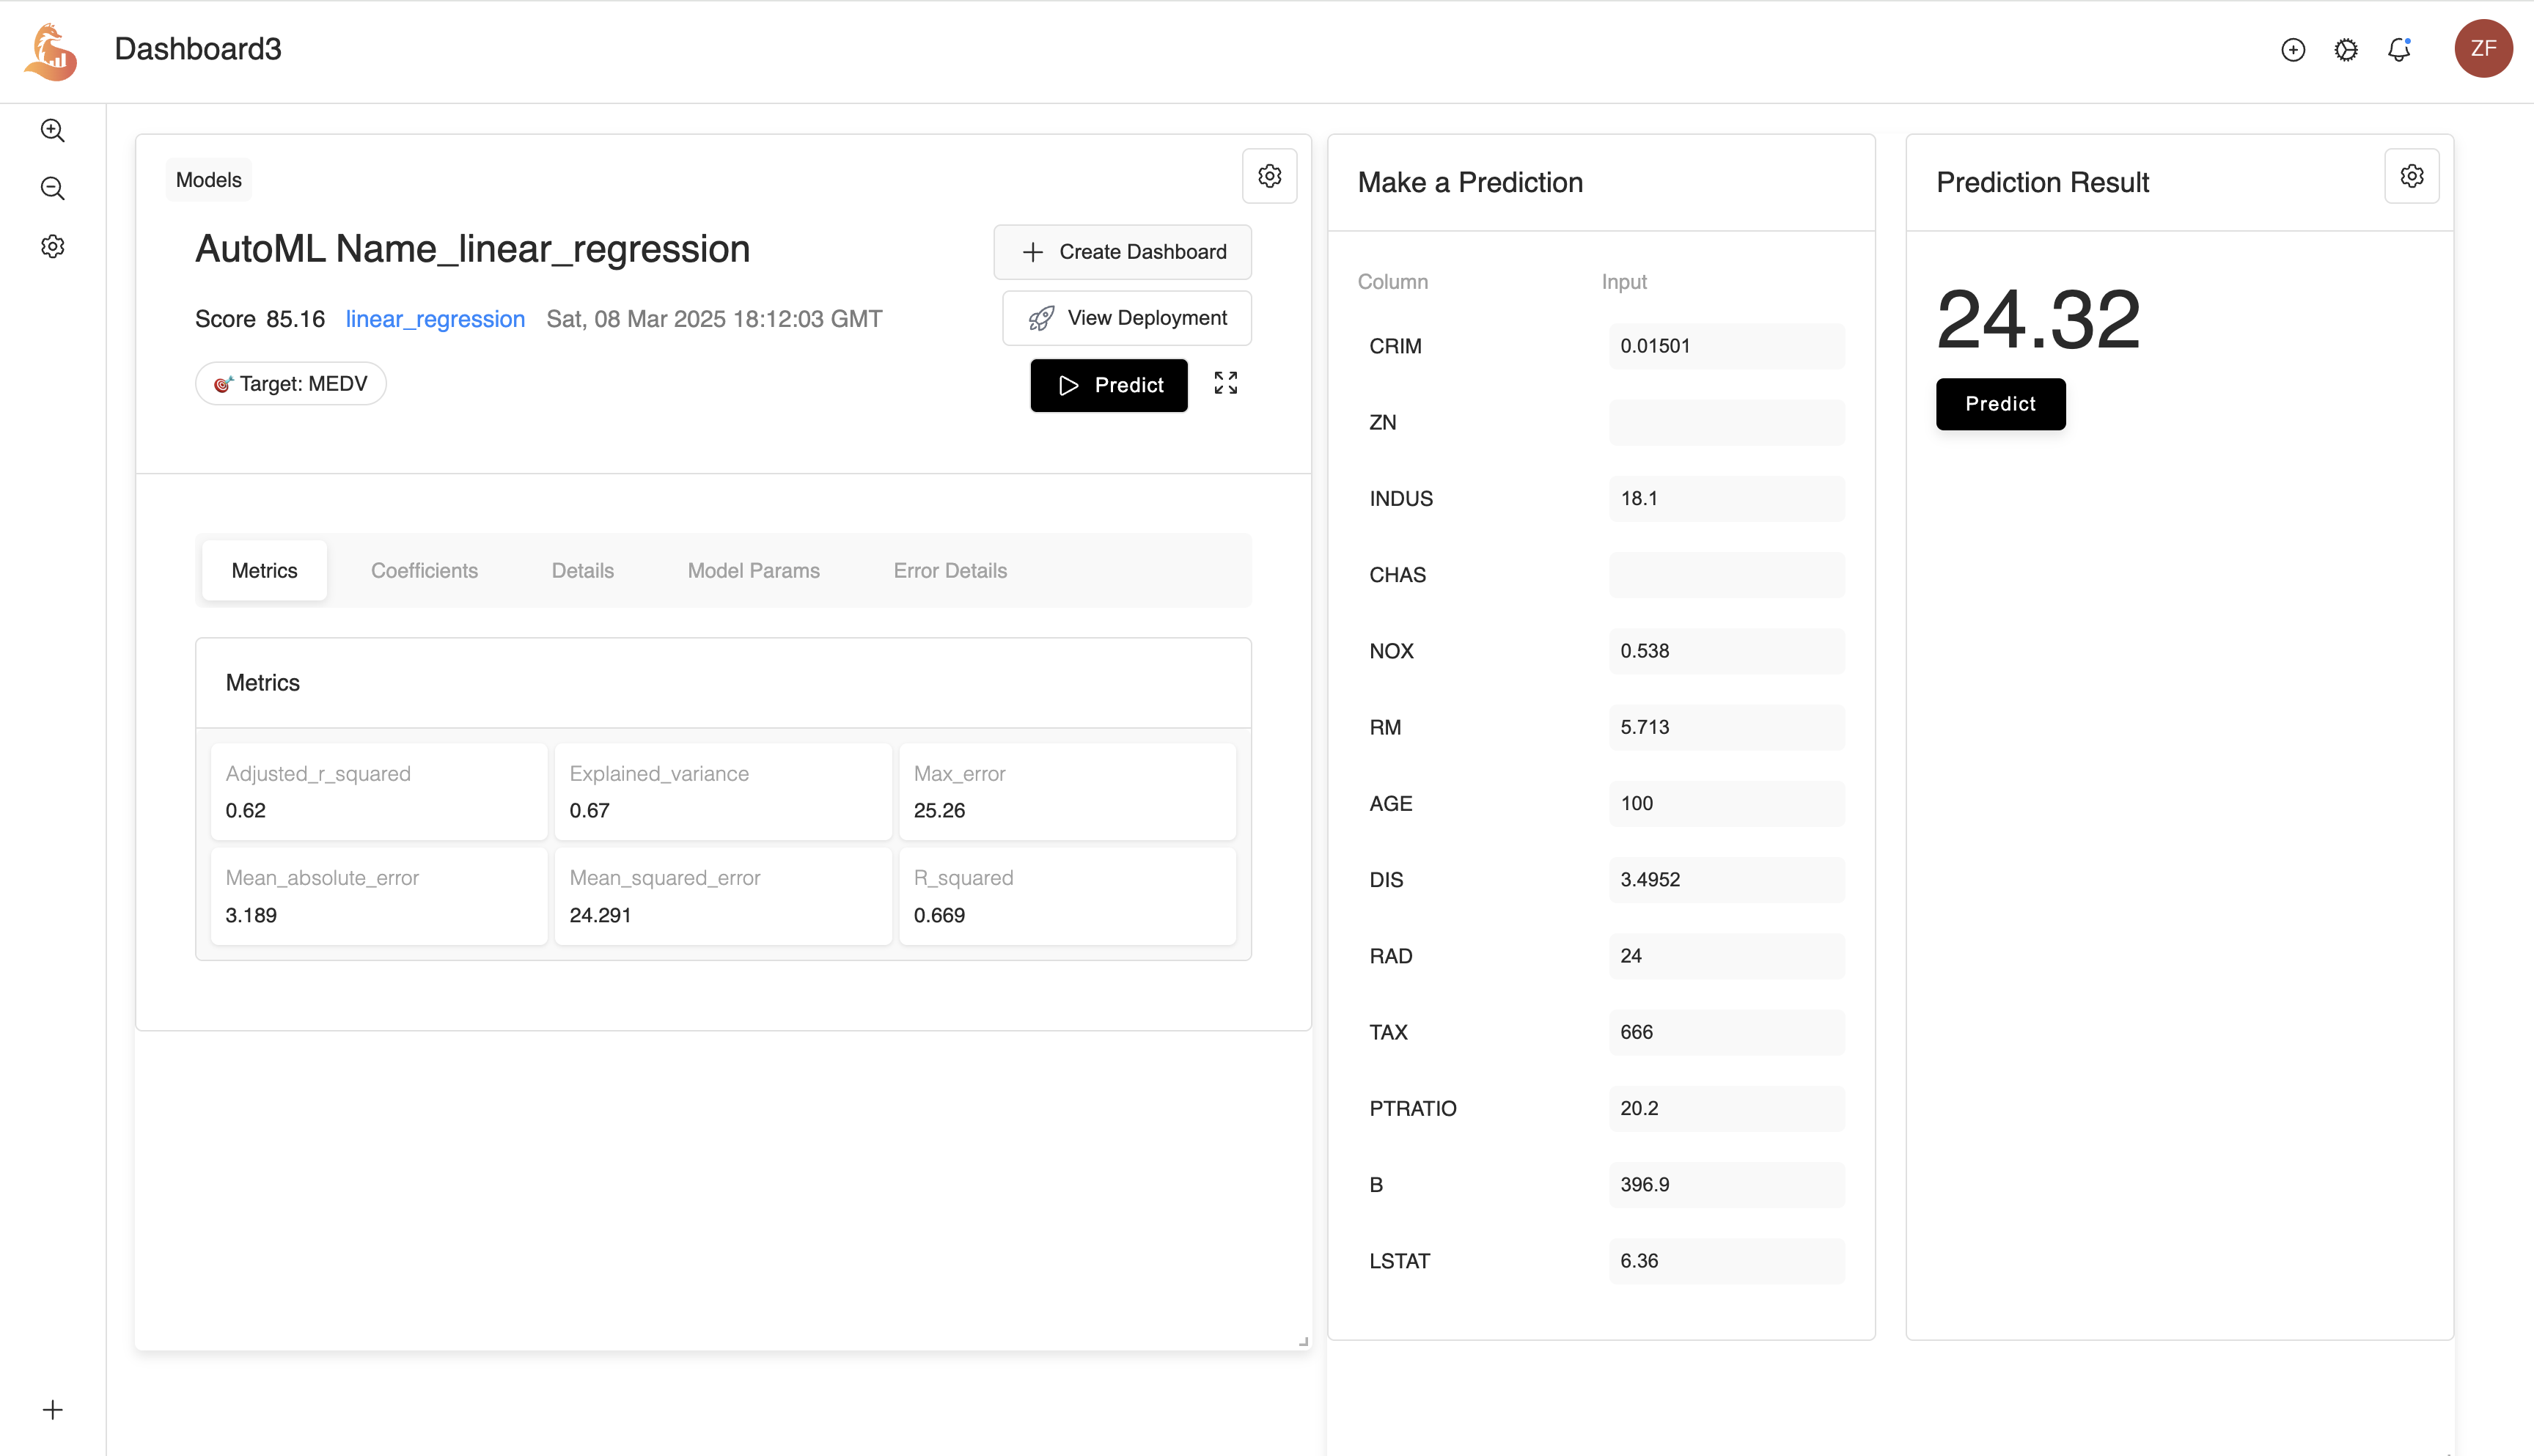
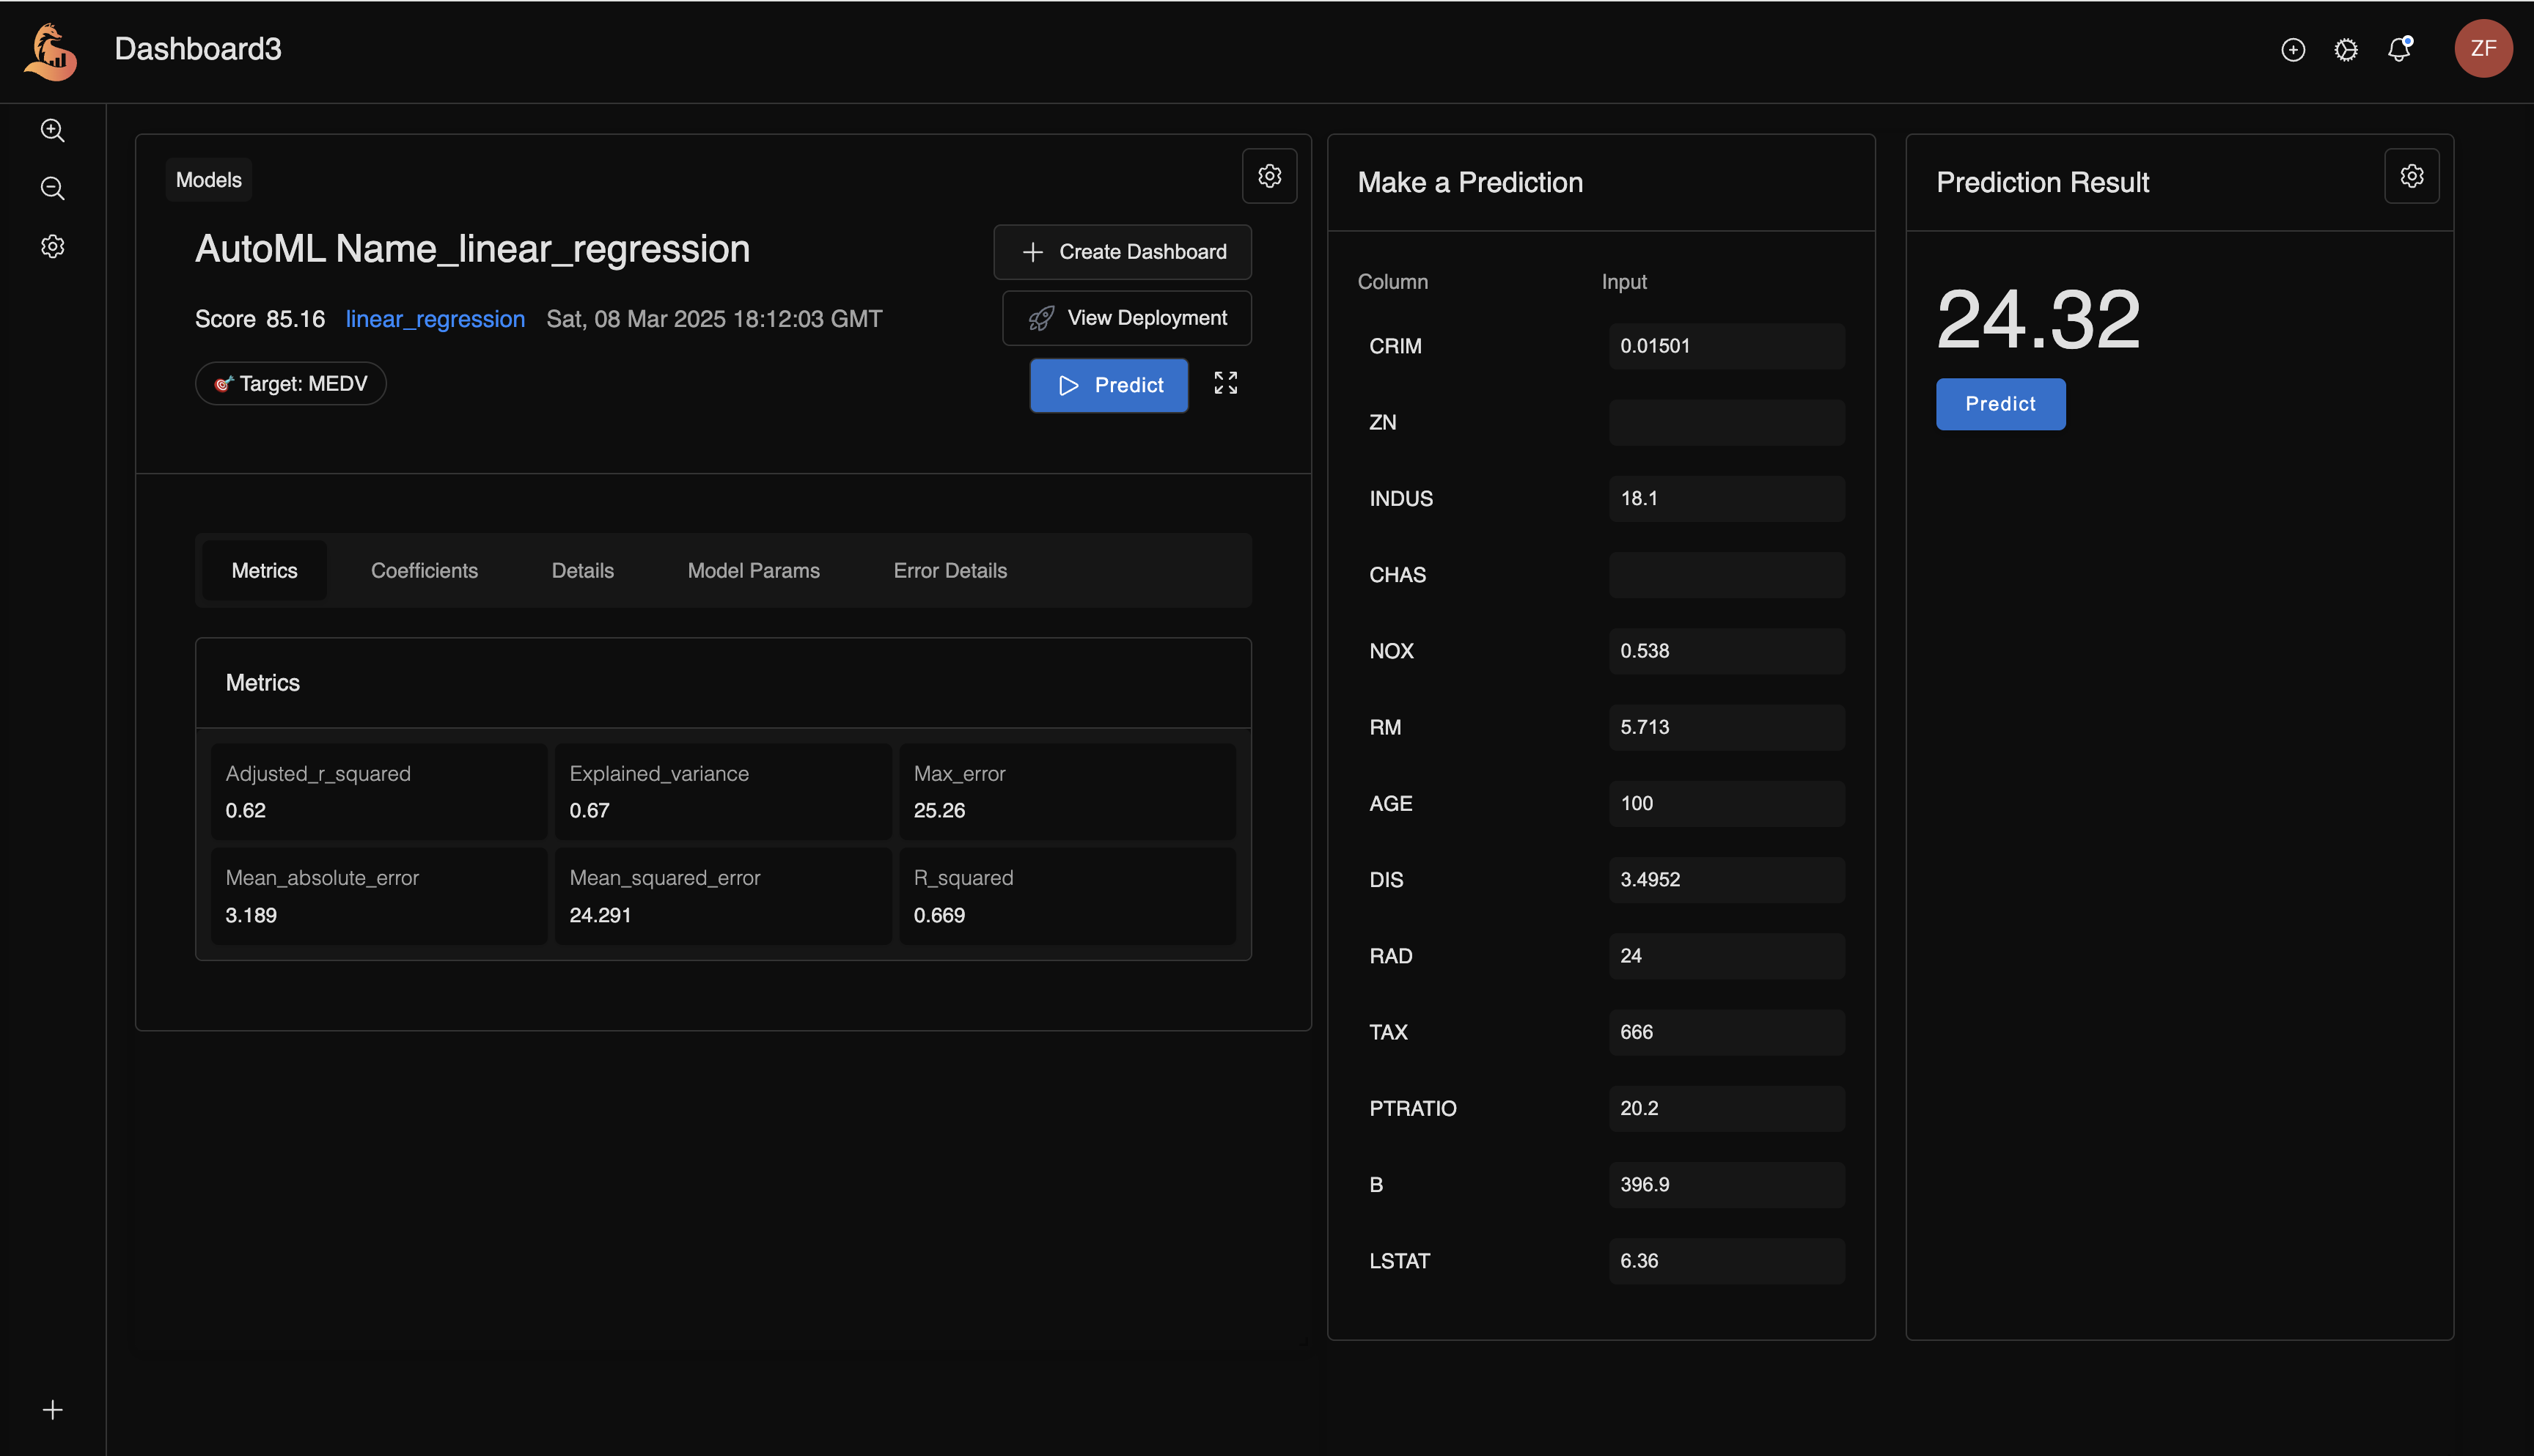
Model Summary
View your model's architecture, parameters, and performance metrics.
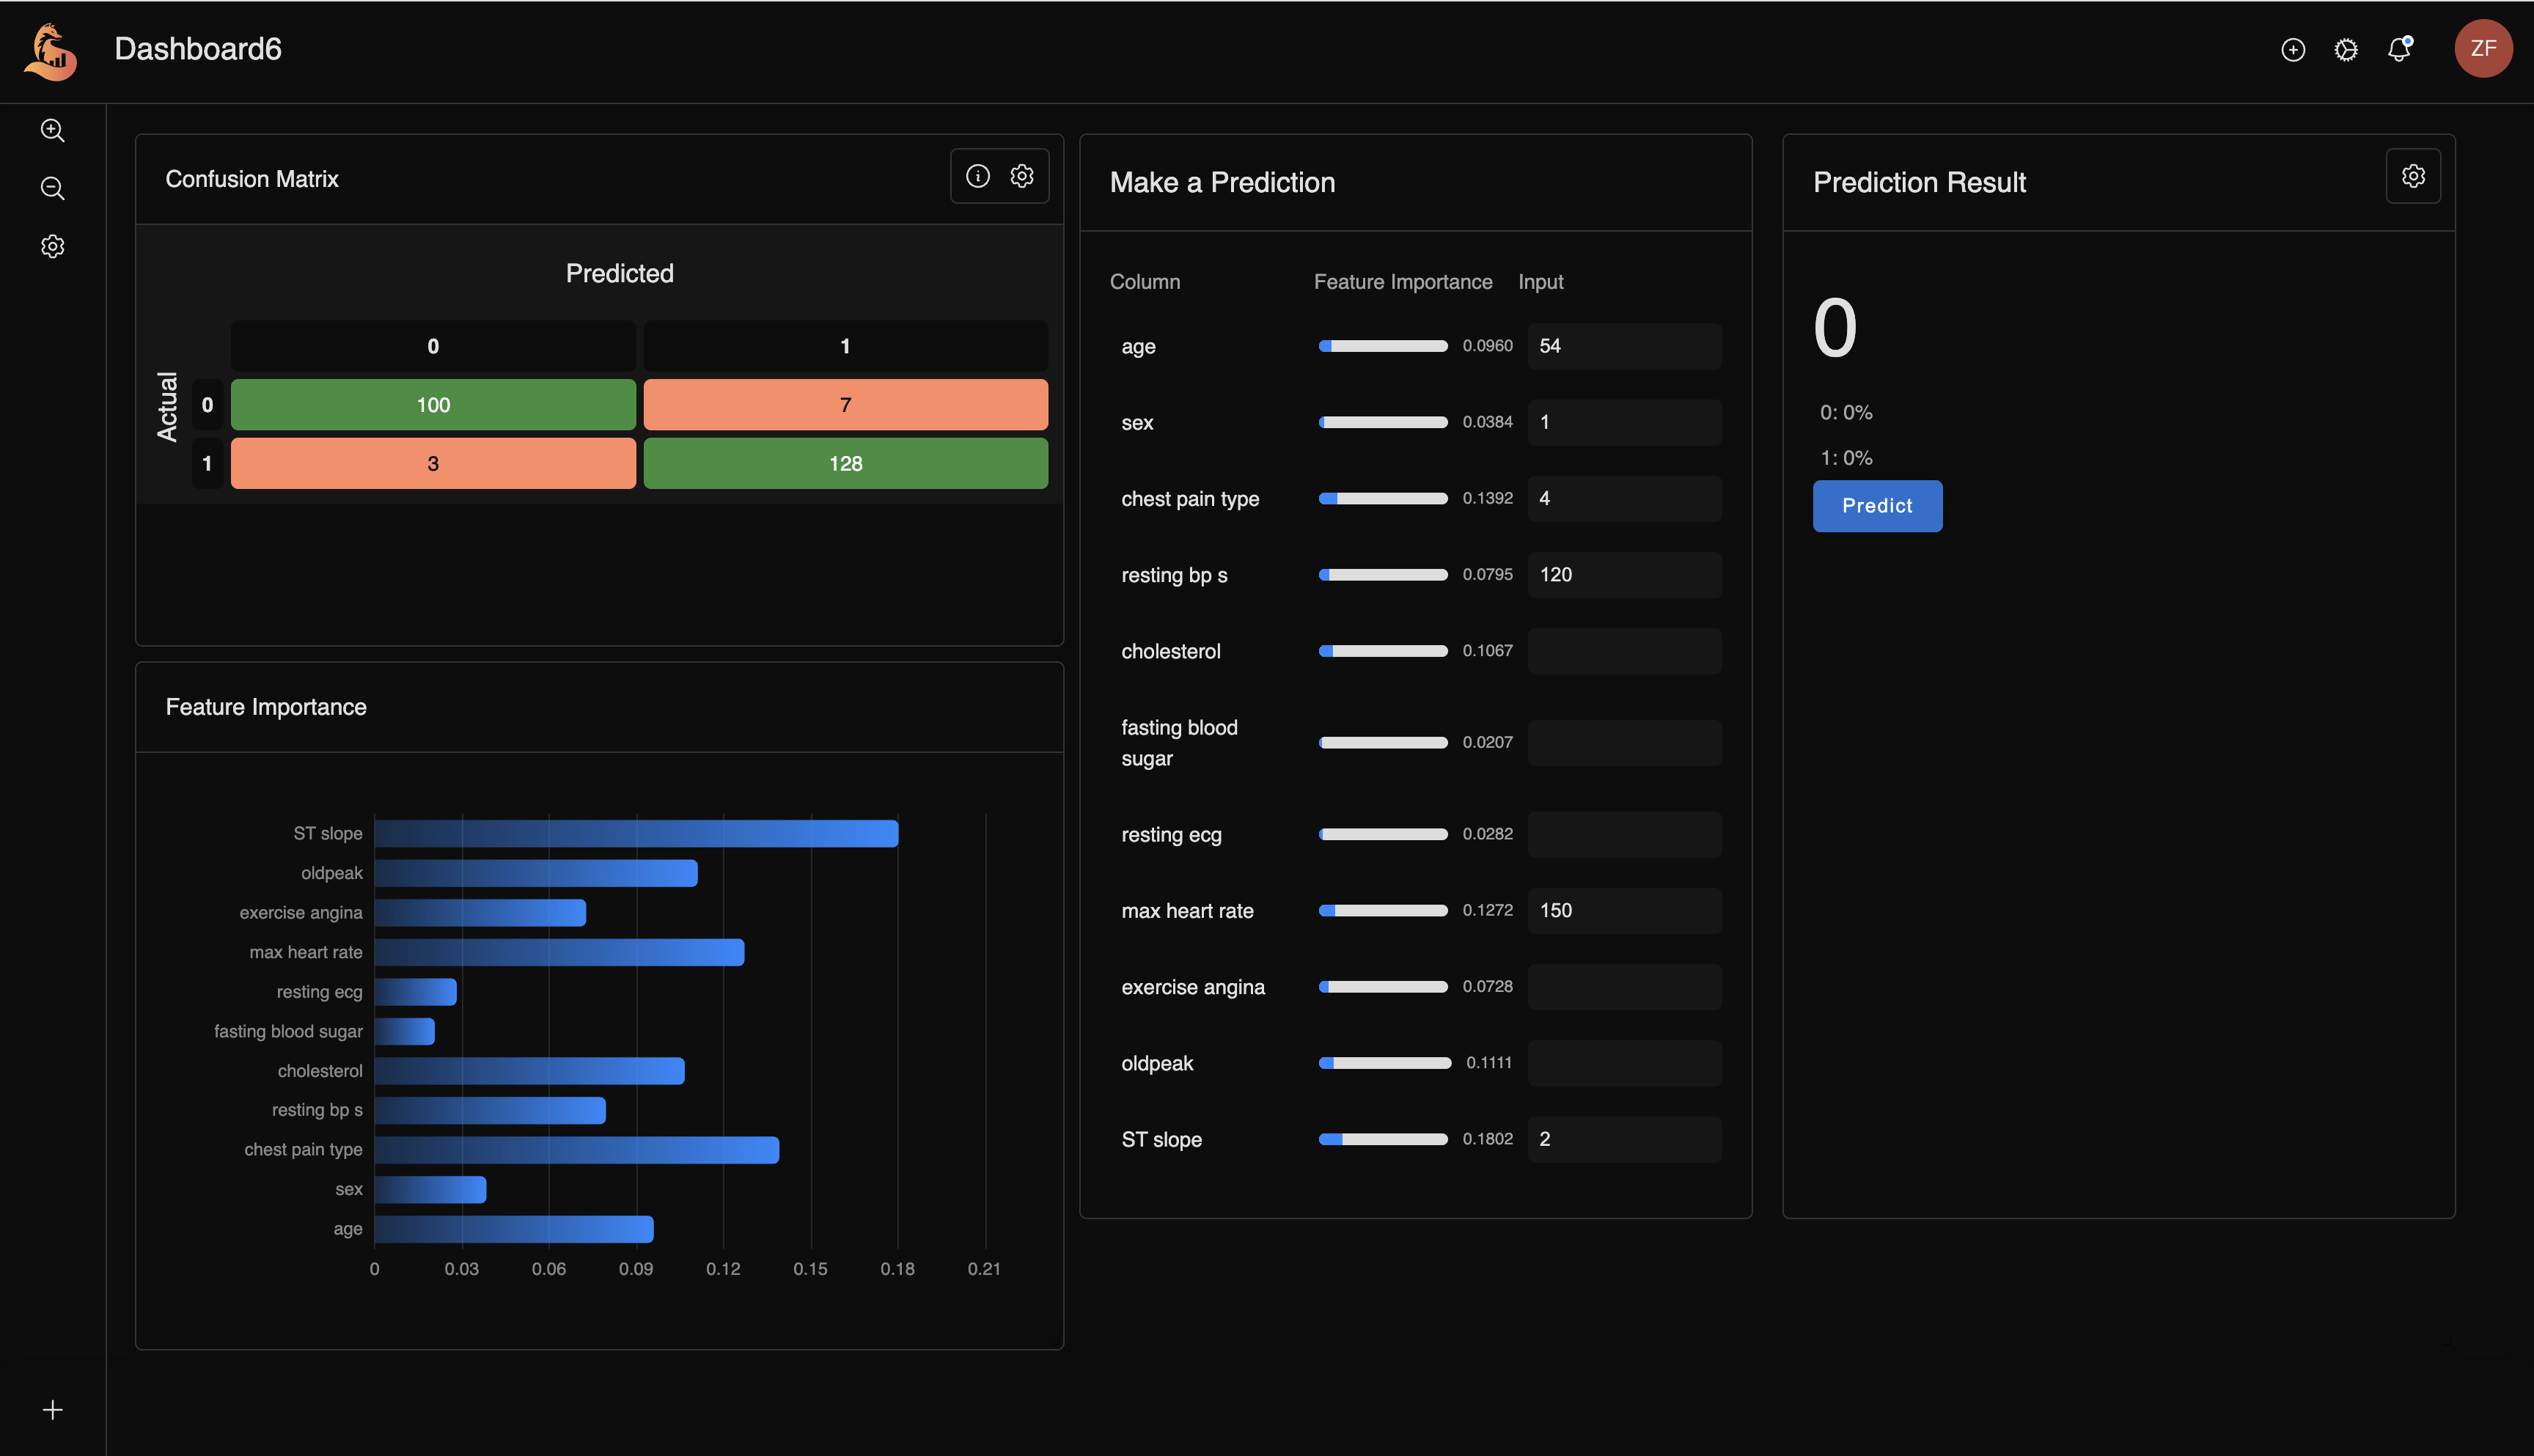
Prediction Interface
Test your model with real-time inputs and view outputs.
Performance Metrics
Track model accuracy, precision, recall, and other key metrics.
Deployment Status
Monitor model uptime, usage, and resource consumption.
Dashboard Builder
Custom ML Dashboards
Build interactive dashboards for data visualization and ML model monitoring. Choose from 40+ components including charts, tables, KPIs, and ML-specific visualizations. Manually arrange components with drag-and-drop or use AI to automatically generate optimal layouts based on your data and models.
Get Started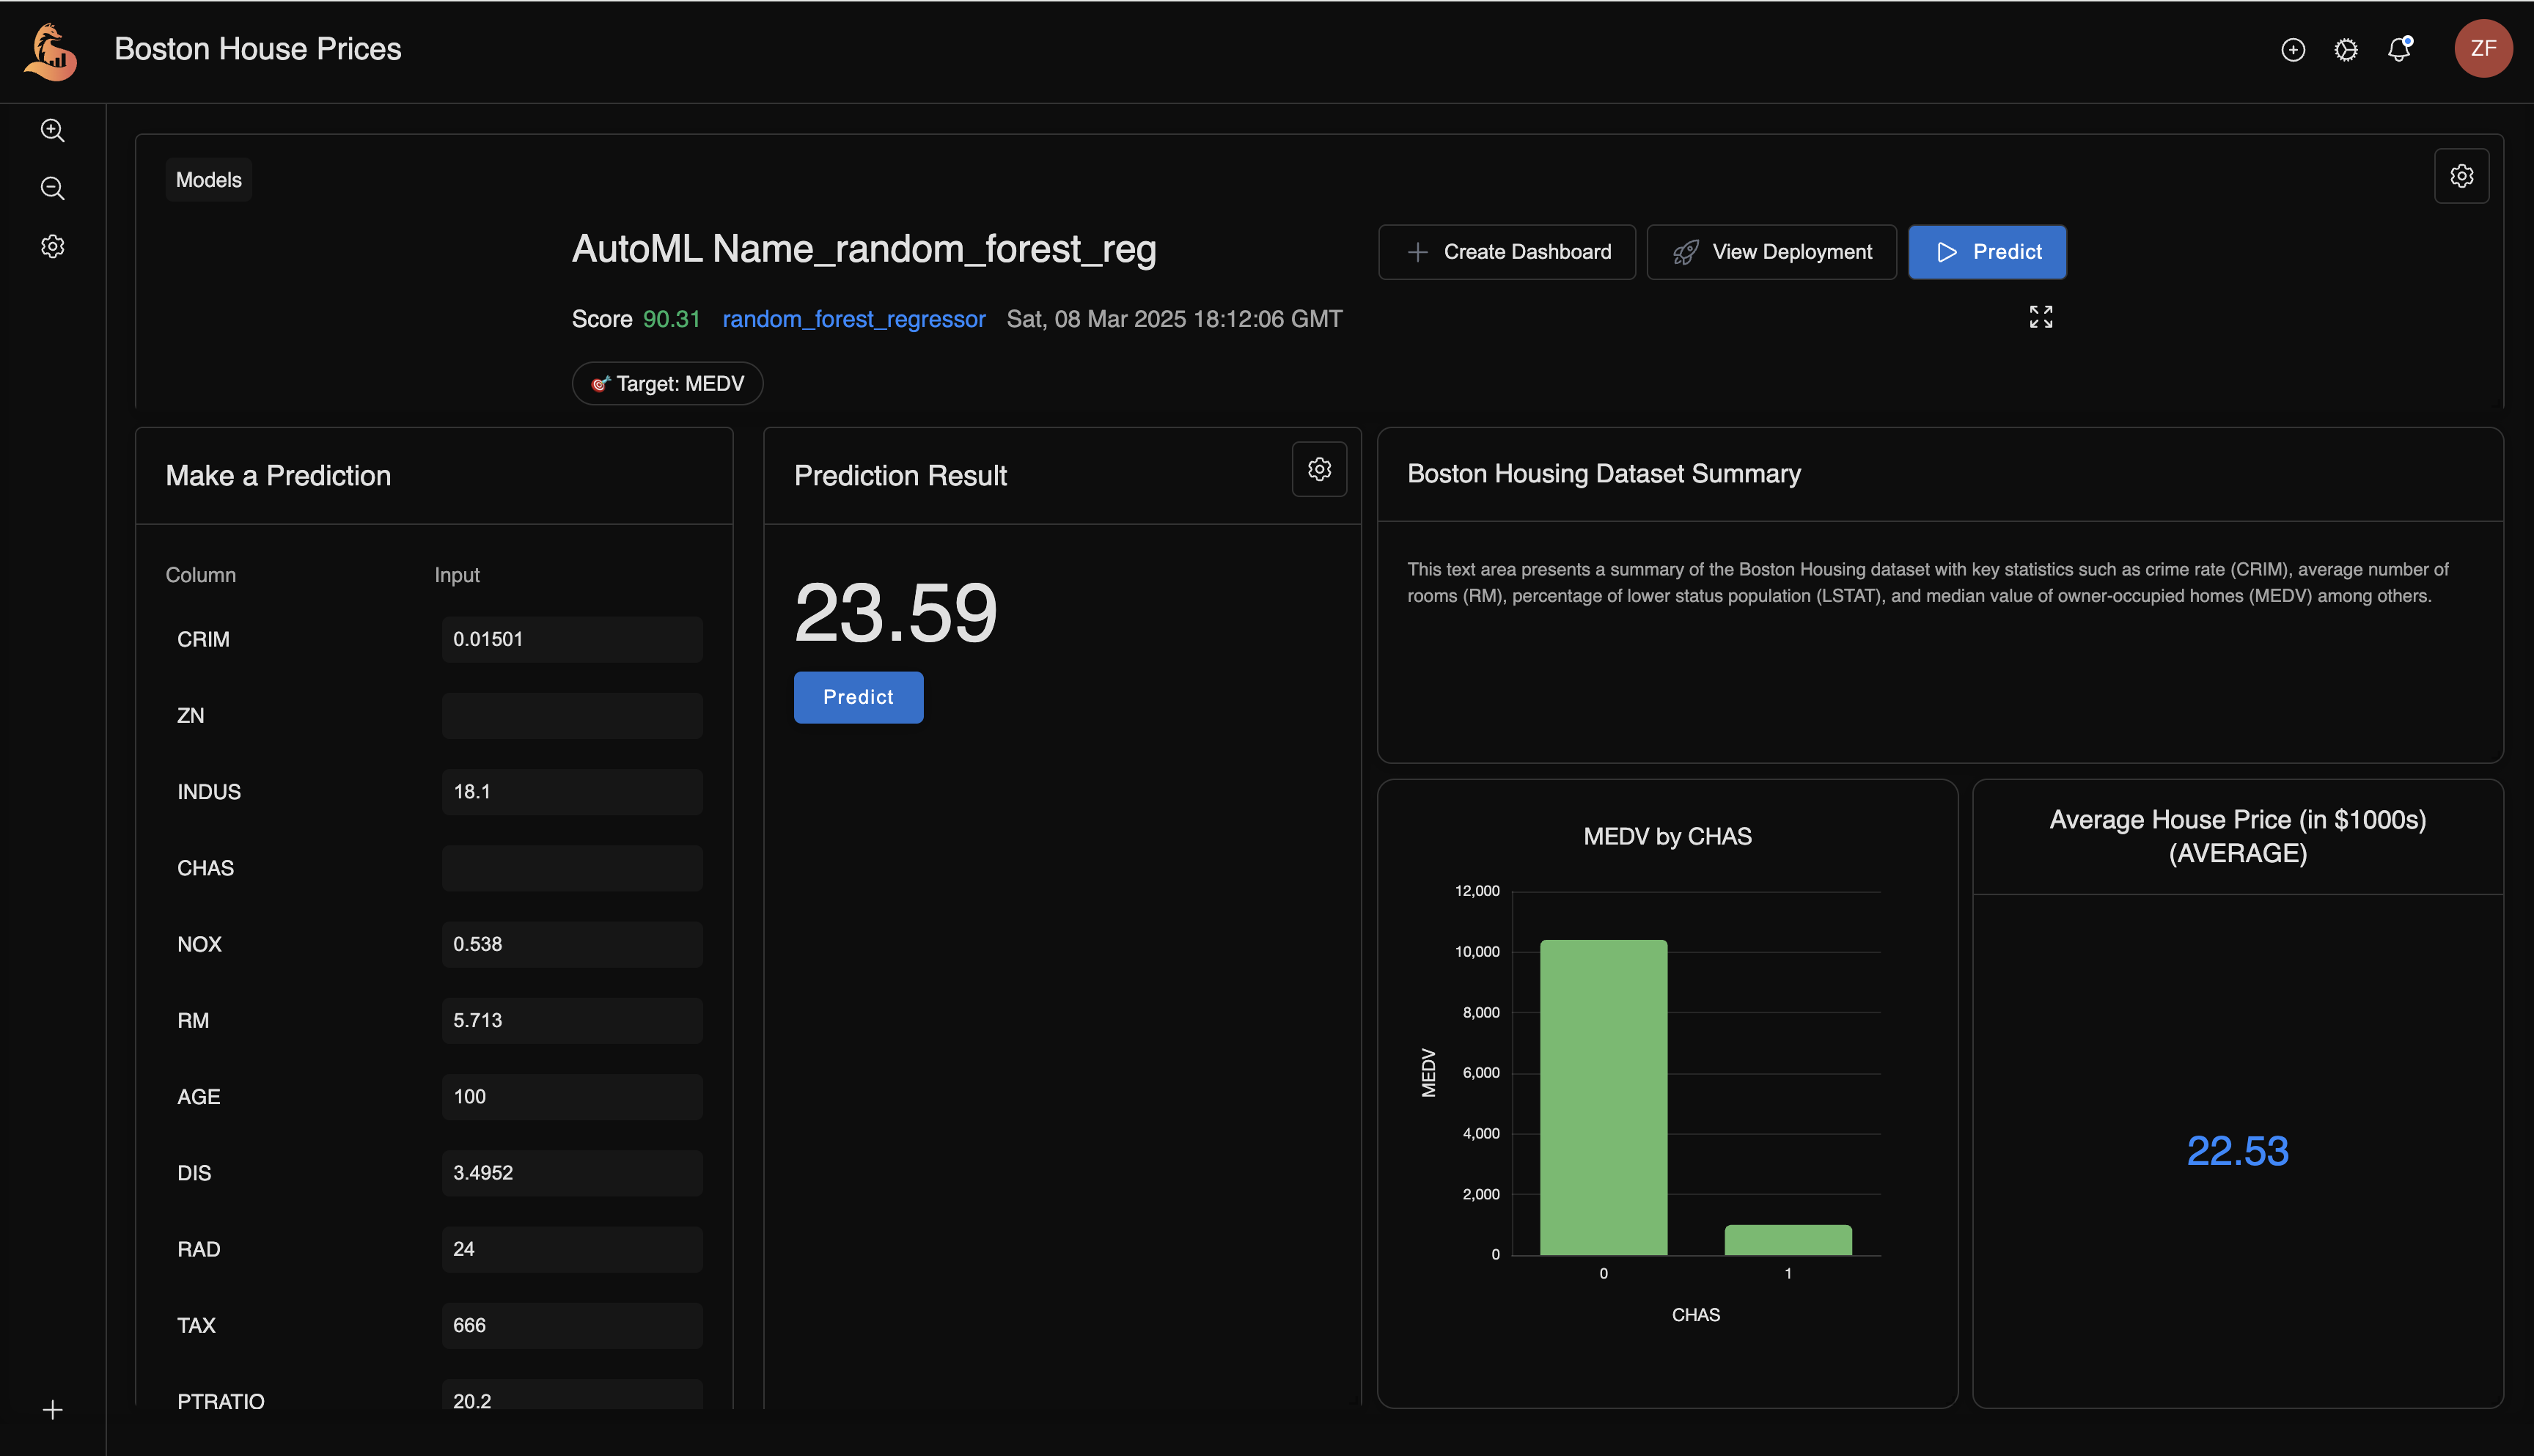
Dashboard Builder
Custom ML Dashboards
Build interactive dashboards for data visualization and ML model monitoring. Choose from 40+ components including charts, tables, KPIs, and ML-specific visualizations. Manually arrange components with drag-and-drop or use AI to automatically generate optimal layouts based on your data and models.
Get StartedVisualization Tools for Data and Models
Dashboard Features
Create dashboards for datasets and machine learning models with customizable components and layouts.
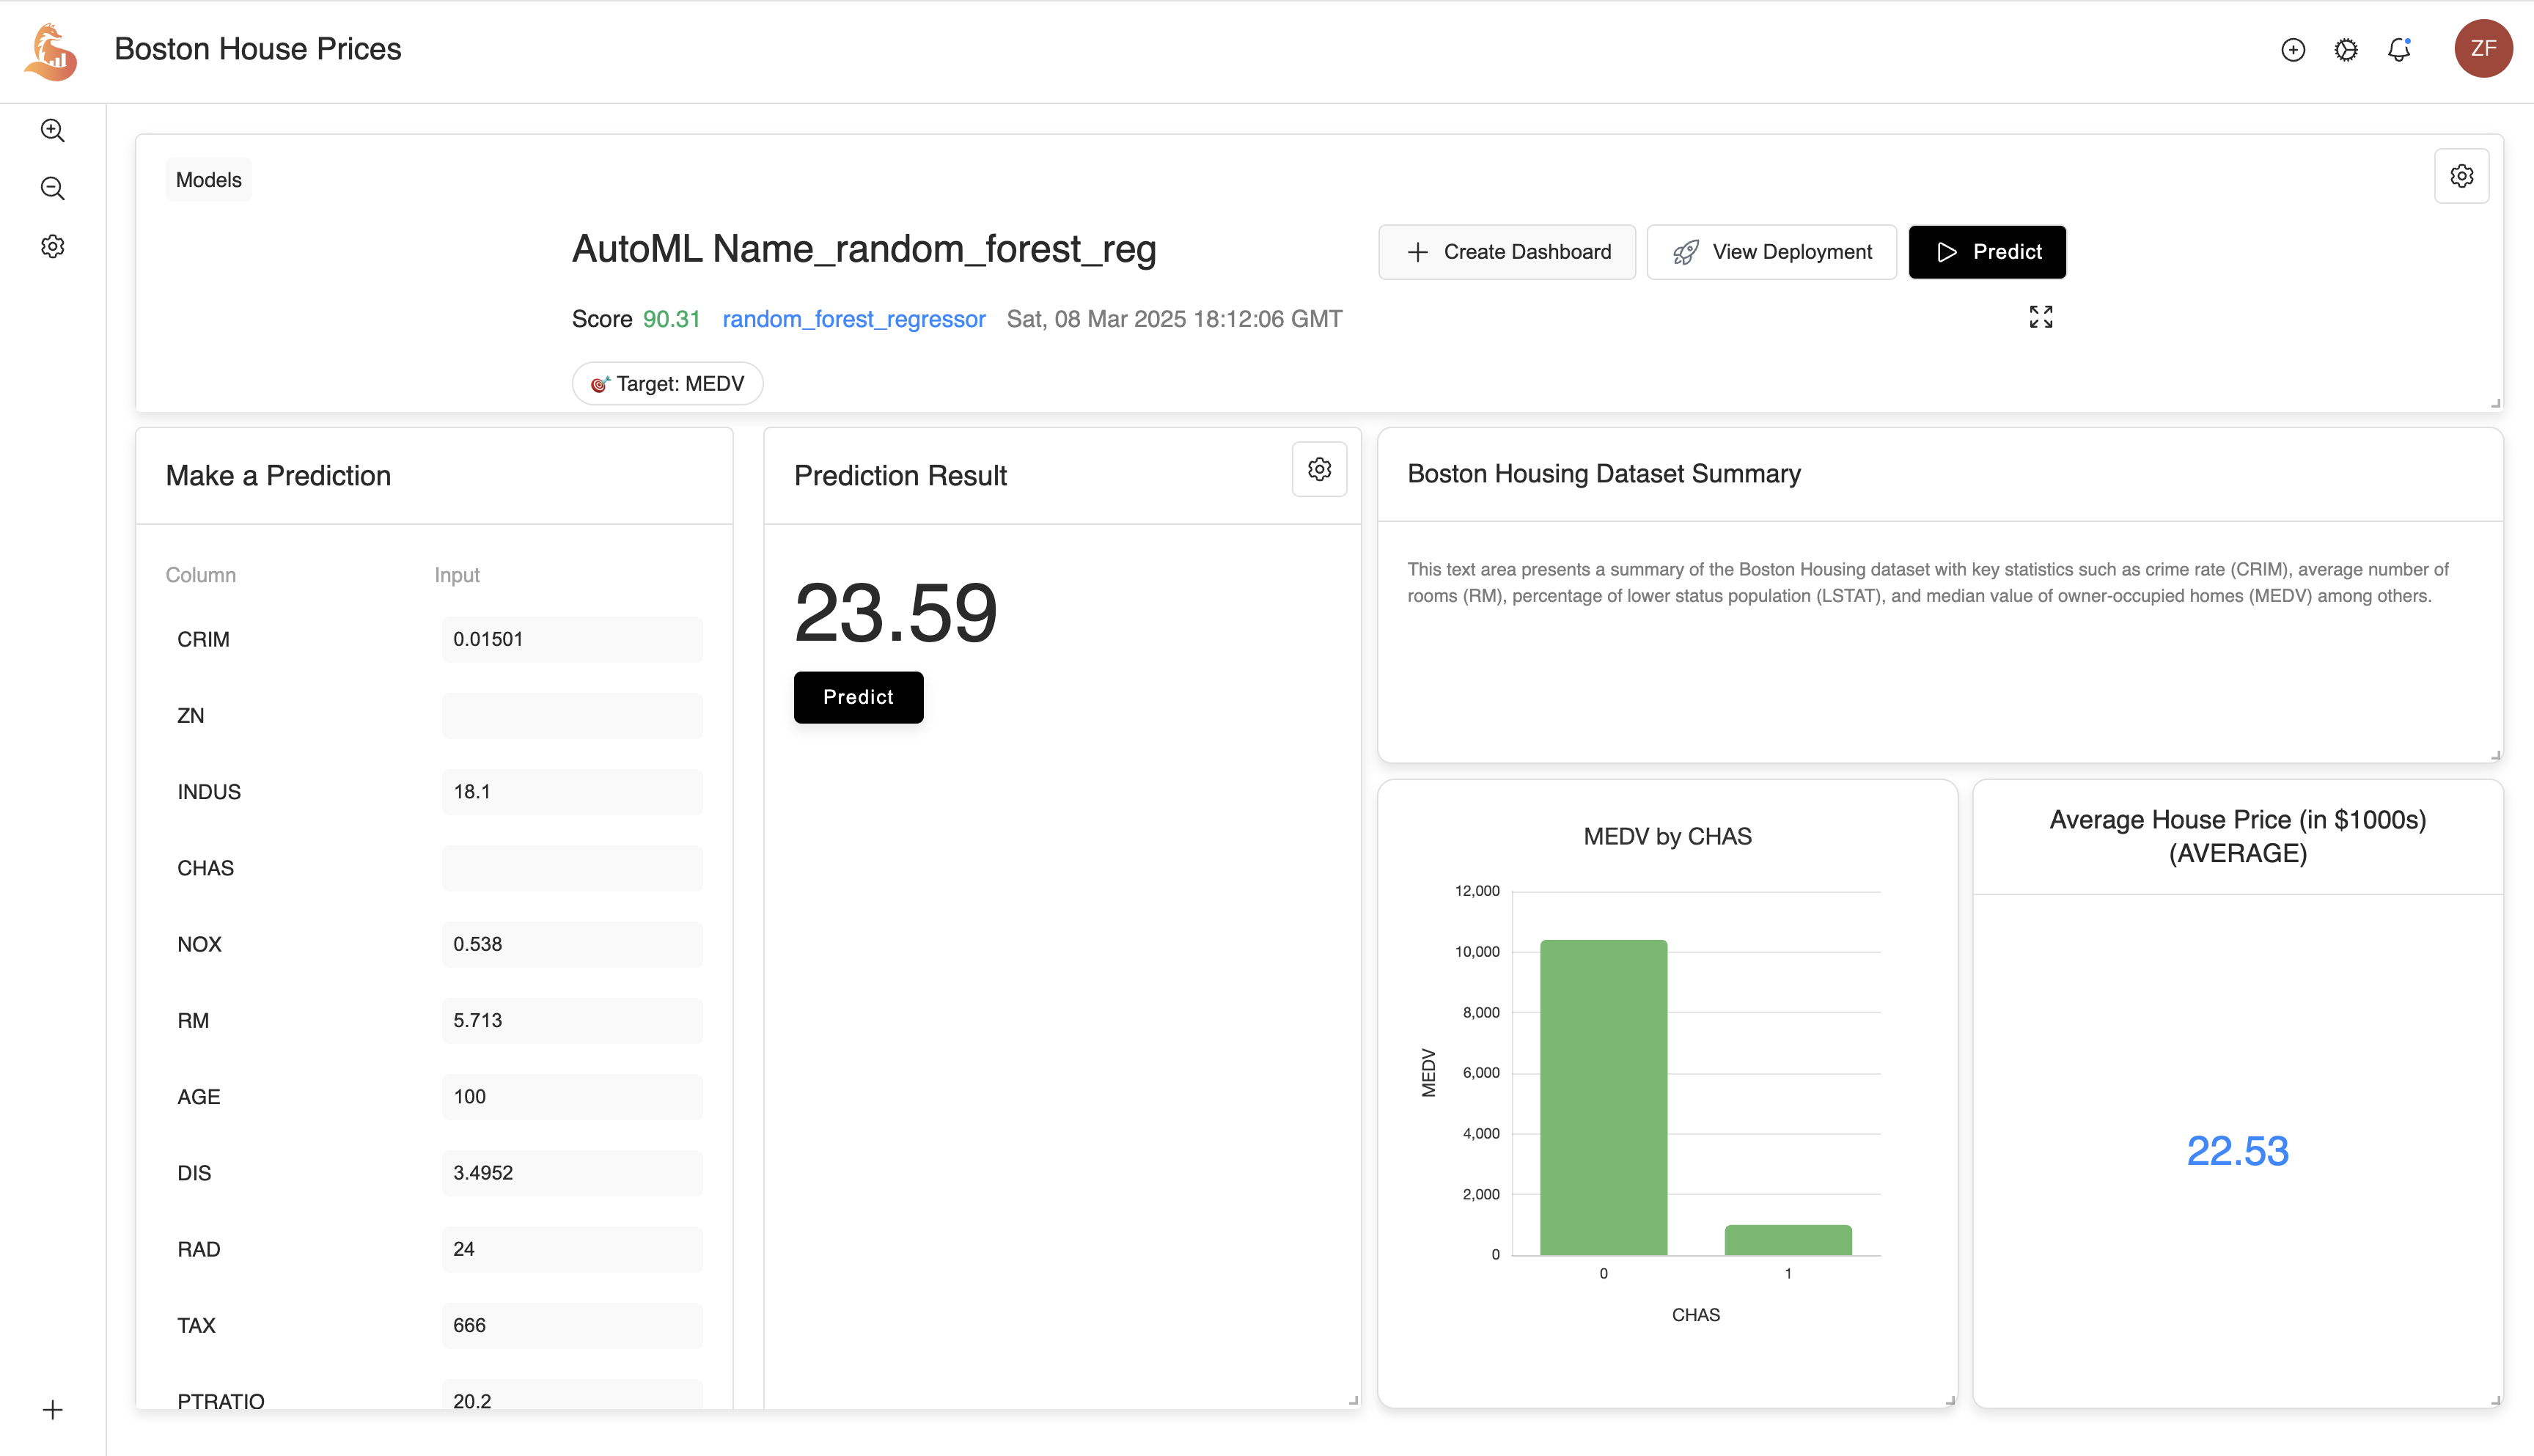
Dataset Visualization
Create visualizations from your datasets with charts, tables, and statistical summaries.
Make a Prediction
Prediction Result
Custom Dashboards
Build dashboards with drag-and-drop tools or let AI generate them for you.
Pipeline Integration
Dashboards automatically generated as part of ML pipelines.
Build Your Way or Use AI
Key Capabilities
Create dashboards manually with drag-and-drop tools or automatically with AI-generated layouts.

Drag and Drop Interface
Arrange, resize, and customize components on a grid-based layout.
AI Dashboard Generation
Automatically create dashboards with appropriate visualizations based on your data.
Automatic Updates
Dashboards refresh to show the latest data and model performance metrics.
Platform Capabilities
A comprehensive set of components for data visualization and ML model monitoring.
Component Types
40+
Standard and ML-specific visualization components.
ML Components
20+
Specialized visualizations for model analysis.
Templates
15+
Pre-built dashboard templates for common use cases.
Visualization Options
Component Types
Choose from a wide range of standard and ML-specific visualization components.
Component Types
40+
Standard and ML-specific visualization components.
ML Components
20+
Specialized components for model analysis.
Template Types
15+
Pre-built dashboard templates for common use cases.
Build Your Own or Use AI
Dashboard Creation
Create dashboards with manual drag-and-drop tools or AI-generated layouts based on your data and models.
Component Selection
Choose from 40+ components including charts, tables, KPIs, and ML-specific visualizations.
Visualization and Analysis
Core Features
Create custom dashboards with standard and ML-specific visualization components, manually or with AI assistance.
Standard & ML Components
Includes basic visualizations (bar charts, line charts, tables) and ML-specific components (model summaries, feature importance).
AI-Generated Dashboards
Automatically create dashboards based on your datasets and models with appropriate visualizations and optimal layouts.
Pre-built Templates
Start with ready-to-use dashboard templates for common ML workflows and customize as needed.