Machine Learning Model Analysis
This dashboard shows detailed performance statistics for your trained machine learning models. View classification metrics like F1-Score and precision, regression statistics like R² and MSE, and visual indicators of model performance. Test models with new data to see how they perform.
View Models
Model Testing
Prediction Interface
This interface lets you test your trained models with new data. Enter values for each feature using sliders or text inputs, then click the predict button to see results. For classification models, you'll see class probabilities. For regression models, you'll get predicted numerical values.
Test Models
Make a Prediction
Prediction Result
Performance Indicators
Model Metrics
Key metrics used to evaluate machine learning model performance.
95.8
Performance Score
Model accuracy score shown as a percentage (higher is better).
Seconds
Processing Time
Most predictions are completed in seconds, even for complex models.
Automatic
Data Visualization
Performance visualizations are generated automatically for each model.
Multiple
Metric Types
Different metrics for different model types (classification vs. regression).
Performance Evaluation
Model Analysis Tools
These tools help you understand and test your trained machine learning models.
Model Performance Dashboard
View detailed metrics for your trained models including accuracy scores and performance statistics.
Make a Prediction
Prediction Result
Prediction Interface
Test your models with new data using simple input forms and get instant predictions.
Model Documentation
Access detailed information about model types, metrics, and usage guides.
AutoML Training
Train multiple machine learning algorithms automatically to find the best model for your data.
Model Library
Trained Machine Learning Models
This screen shows all your trained models with their performance scores. Each card displays the algorithm type (like Random Forest or XGBoost) and its performance score. Green indicators show which models are ready to use for making predictions.
View Models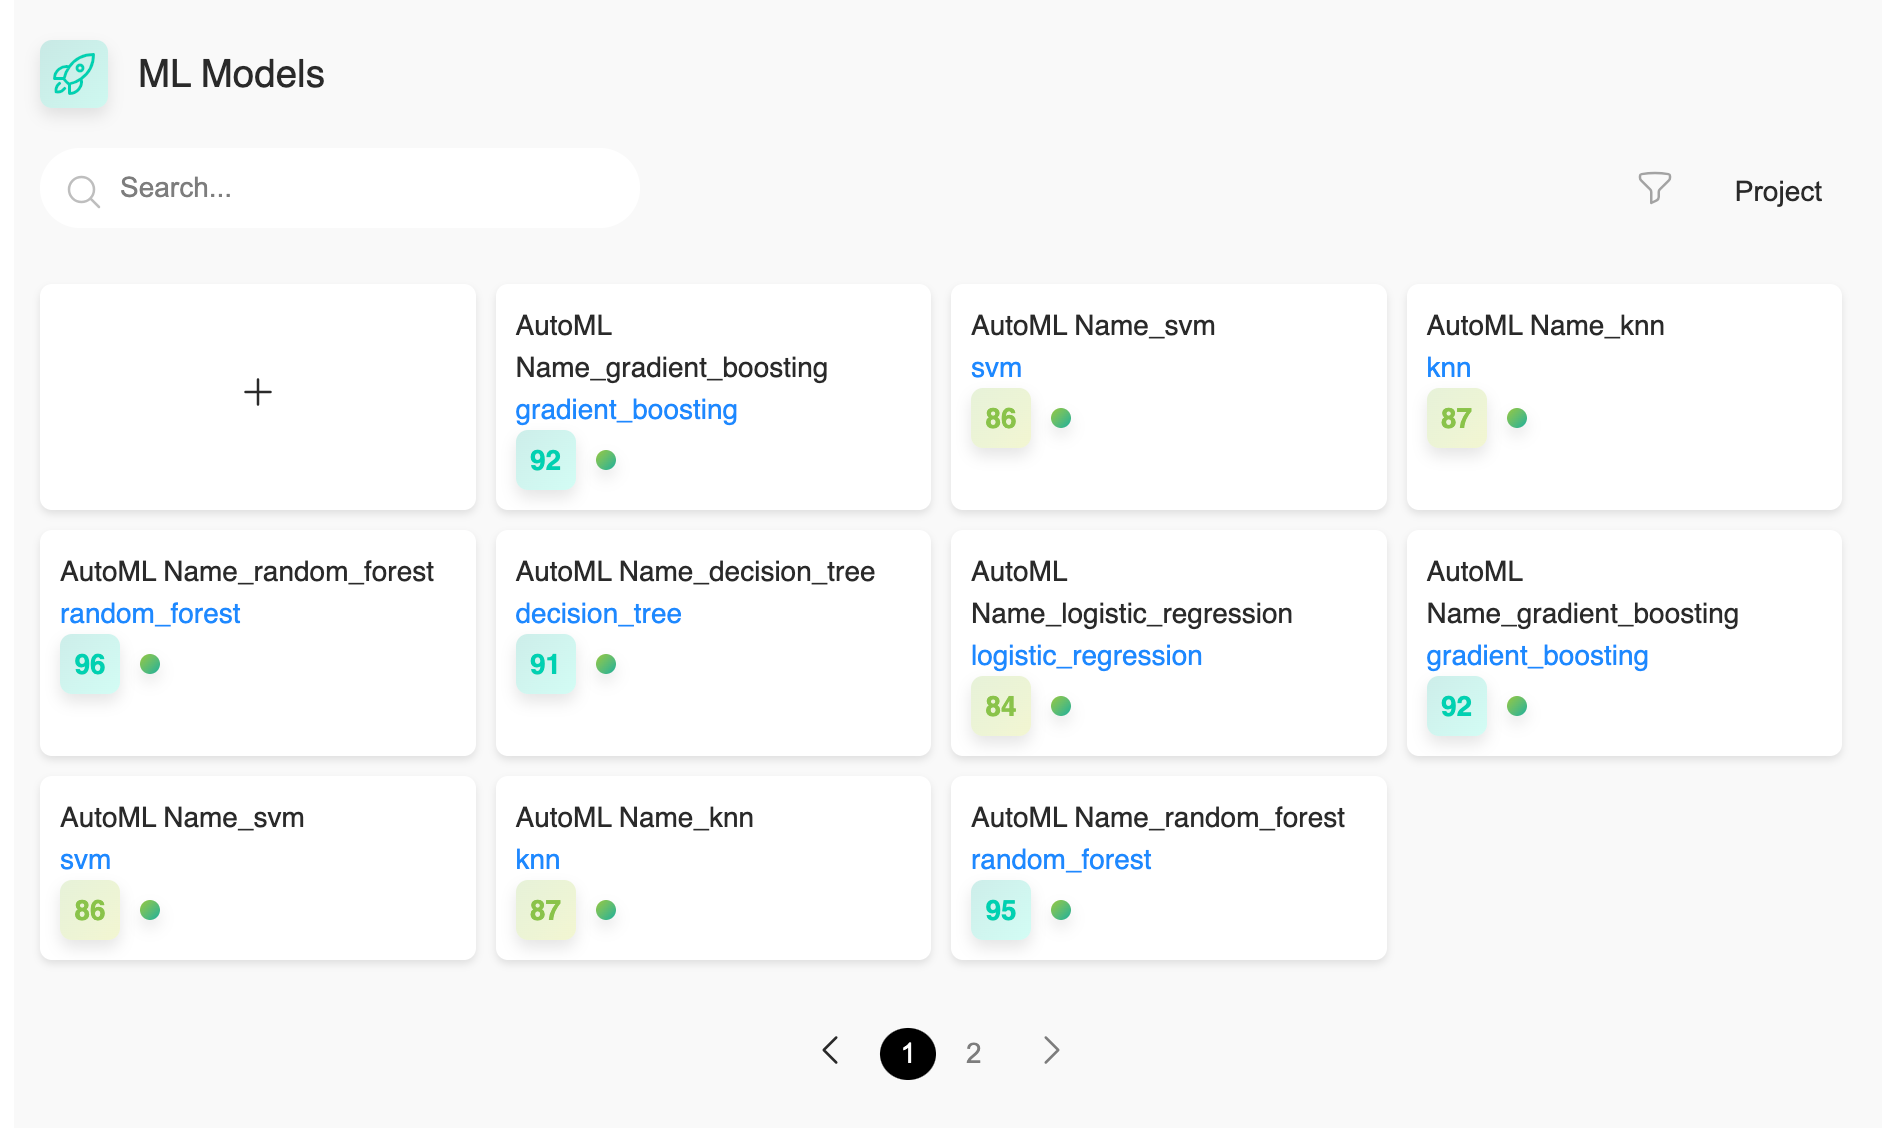
Model Analysis Capabilities
Key Features
These features help you evaluate and understand your machine learning models.
Model Metrics Visualization
View performance metrics through interactive dashboards showing accuracy scores, error measurements, and other statistics for your trained models.
Model Testing Tools
Test how your models perform on new data using intuitive interfaces. Enter feature values and get instant predictions to validate performance.
Training Progress Tracking
Monitor the training process of your machine learning models with visual indicators showing each stage of the pipeline and performance scores.
Performance Statistics
Model Metrics Dashboard
The metrics dashboard shows detailed performance statistics for your model. For classification models, it displays F1-scores, precision, and recall values. For regression models, it shows R² score, mean squared error, and other accuracy measures. You can switch between different metric views using the tabs.
See Metrics
Analysis Features
The model analysis dashboard provides these capabilities.
Model Types
Multiple
Support for classification and regression models with appropriate metrics.
Visualization
Automatic
Performance charts and graphs generated for each model.
Detail Level
Comprehensive
View overall scores or drill down into specific metrics and parameters.
Evaluation Measures
Performance Metrics
These metrics help you understand how well your models are performing.
Classification Metrics
Multiple
F1-scores, precision, recall, and confusion matrices for classification model evaluation.
Regression Metrics
Detailed
R² scores, MSE, MAE, and other metrics for regression model assessment.
Feature Analysis
Visual
Charts showing which features have the biggest impact on model predictions.